Comparison: Manual or automatic semantic analysis?
Published on January 21, 2021 - Updated on November 05, 2024
Comparison: Manual or automatic semantic analysis of verbatim?
When you conduct surveys or want to analyse customer feedback in depth, it's very complicated to know how to go about it.
Indeed, when dealing with open-ended responses or verbatim comments from review sites, the task is much more difficult than averaging closed-ended responses.And yet this is the richest source of information about your customers. It would be a shame to do without it, wouldn't it?
How do you analyse a verbatim?
There are two main distinct methods for carrying out a semantic analysis. Both can be useful and have their own specific uses, depending on the volume of data to be processed, the budget, the time available to allocate to the task, etc.
In this article we are going to take a look at the two methods used to carry out a semantic analysis of your customer verbatim: manual analysis and automatic analysis.
1. Manual analysis of customer verbatim
This is traditionally carried out using the post-codification technique. This method consists of defining response themes and then assigning them a number. This enables open-ended responses in surveys to be processed with a level of precision approaching that of closed-ended questions.
To carry out this analysis, you can use spreadsheet software such as Excel or equivalent. Next, you need to define the themes corresponding to your survey. You can also define sub-themes to improve the accuracy of your results.
Once this stage is complete, select all the responses to your questionnaire (or a representative sample), then note the number of the corresponding theme or sub-theme next to each response.
For a better understanding, let's look in more detail at how to carry out this analysis using a concrete example.
1.1 Defining the survey themes
Manual verbatim analysis can be applied to any type of verbatim, whether from a survey or from reviews on online platforms (TripAdvisor, TrustPilot, Google Reviews, AvisVérifié, Critizr, etc.).
For the purposes of this analysis, let's take the example of a survey in the banking sector with an open question such as ‘Are you satisfied with your bank branch?’.
When you find out the answers to the questionnaire, define the themes that emerge and that seem most relevant to you.
Possible themes:
- Staff
- Staff welcome
- Ability to listen
- Expertise & Skills
- Availability
- Agency
- Opening hours
- How to get there
- Geographical proximity
- Atmosphere
- Customer journey
- Making an appointment
- Support
- Cancellation
- Product
- Current Accounts
- CB/CR
- Tariffs
However, the coding plan must be fixed at the time of coding. For the sake of comparability, it should not be changed too often. Any addition of a theme during the course of the analysis could require a new analysis of all the data already classified as well as the historical data. In contrast to an automatic classification tool, the thematic map is therefore not very open-ended.
On an ad hoc basis and if comparability with your other surveys or sources of customer opinions is not useful, we advise you to add topical subjects to your themes.
In addition to analysing the themes raised, you can also classify comments by sentiment (positive, negative, neutral) or primary emotion. In order to carry out a cross-analysis, it is therefore necessary to make the themes neutral and valence-free.
For example: The Personnel > Availability theme should include both moments of availability and moments of staff unavailability. It is the feeling/emotion dimension that will add the level of satisfaction or emotion to the message.
To organise your time: Allow between 1 and 3 days to draw up a coding plan that can be used for future surveys.
1.2 Example of manual verbatim analysis: Coding
Now that our themes and sub-themes have been defined, the real work begins! We now need to assign the corresponding number to each of the survey responses. To give you a better idea of the task, here's an example with 10 customer comments:
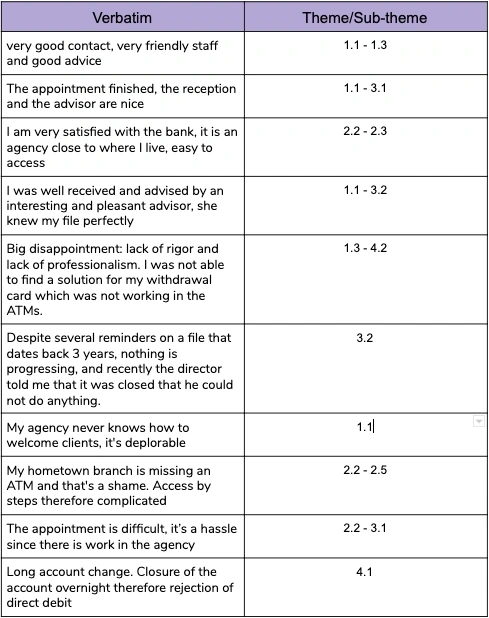
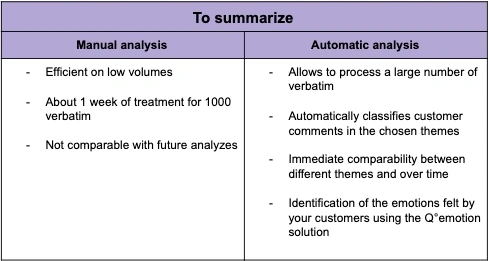
To summarize, manual semantic analysis of verbatim with coding allows for thorough and precise results. On the other hand, the preparation and the analysis are very time consuming because it is necessary to go through all the verbatim. To limit the coding time, we can use a random extract (eg: each answer every 10 answers is coded) but therefore the analysis is no longer exhaustive and problems of statistical representativeness may arise.
It should also be noted that the longer the verbatim, the more tedious the classification.
On the other hand, if the verbatim are multilingual, it will be necessary to ensure that the analyst will master all the subtleties of the different languages of expression in order to proceed with the proper consolidation of the results by country or by language.
Therefore, depending on the volume of the survey (or other sources of advice), the length of the comments, it is not advisable to use this time-consuming and resource-intensive method and instead opt for the analysis automated.
On the other hand, the efforts made are not capitalized for future studies or data. Any new analysis will require starting from scratch.
In addition, although the results are accurate, there may be a human bias in responses related to lack of objectivity depending on each analyst. For the same data, the results may indeed vary from one person to another depending on the perception and personal experience of the person who coded the survey or analysis. This bias can be a particularly important problem if there are prejudices or corporate culture that do not spontaneously encourage listening to the customer.
Finally, these manual analyzes are difficult to compare with each other.
To organize your time: Allow between 2 to 3 minutes per verbatim to classify, i.e. approximately 1 week for 1000 short verbatim and 1 week 3 days for 1000 long verbatim (greater than 144 characters). This time is in addition to the time dedicated to designing the codification plan.
Our recommendation: Using the analysis of customer comments by manual coding can be good for getting to know what customers say and their opinion, but it is always very time-consuming. If your survey or opinion source has a significant number of comments and you want to be thorough, you will quickly find yourself overwhelmed. This analysis is therefore particularly suitable for small amounts of data.
As briefly explained previously, there is another much faster and better way to analyze your customer feedback: automated verbatim analysis.
2. Automatique Verbatim Analysis
Unlike manual analysis, a semantic tool is able to analyze a large number of verbatim in no time and identify the subjects and themes that emerge from them.
2.1 How automatic analysis works
You have to understand that in the vast majority of projects, setup times are negligible and that this approach allows you to go more directly to analysis and research of insights. On the other hand, in addition to the automated analysis itself, the solution provides you with visualization tools that allow you to go directly to the data and easily discover the lines of analysis relevant to your survey. By choosing the analysis grids for your sector offered by the solution, you save configuration time and you can even benefit from a sector benchmarking vision.
In this article, we'll walk you through how to use an easy-to-learn tool like CXinsights.io, which can help you speed up your customer feedback analysis ... and find insights quickly and effortlessly.
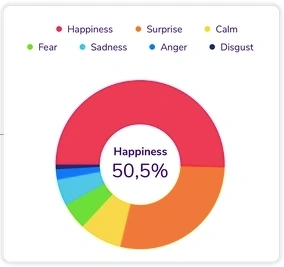
First of all, you should know that the algorithm of the CXinsights.io solution is able to identify the topics discussed and associate a felt emotion (among the 6 primary emotions: joy, surprise, fear, sadness, anger, surprise) to reveal new insights at a glance.
If the verbatims are multilingual, the classification will allow the processing of each verbatim in a transparent way to easily give results by country or by language.
The size of the comments has a marginal impact on the processing times of the automatic classification tools.
To start your analysis, all you need to do is import your data file into the SaaS platform. You can also import verbatim directly from Google Reviews, Trustpilot, Tripadvisor and other review platforms if needed.
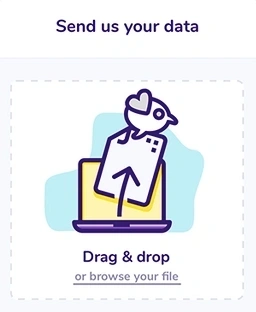
You just have to wait a few moments for the algorithm to automatically process your data and give you the first results.
On the CXinsights.io automatic analysis platform, you can choose a theme corresponding to your industry or even customize your entire project based on personalized themes and sub-themes that seem more relevant to you. This setup only takes a few minutes. Customization of themes, routes etc. is also possible on request (custom setting requiring a few hours of additional work).
Note: unlike manual analysis, any customization effort made during project configuration can be capitalized on all data.
For example, if you create a new topic even 2 months after the first treatment, you can update all the data effortlessly in minutes.
To organize your time: Once the file has been submitted, plan a processing time of 2 to 3 minutes per batch of 5000 verbatim to classify, or about 20 minutes for 50,000 verbatim. The tool will then automatically place all verbatim in the corresponding themes and you can immediately access data navigation.
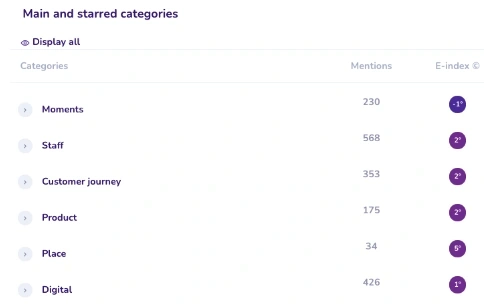
You can compare at a glance the number of comments by theme as well as the main emotion that emerges (the E-index in the screenshot below corresponds to a temperature varying from -20 ° C to + 40 ° C defined by the main emotion detected in the speech, the higher the temperature, the more positive the emotion).
Monitoring is much more easily done than with manual analysis, the tool offers you a follow-up of the evolution of emotions in customer verbatim as well as of the E-Index.
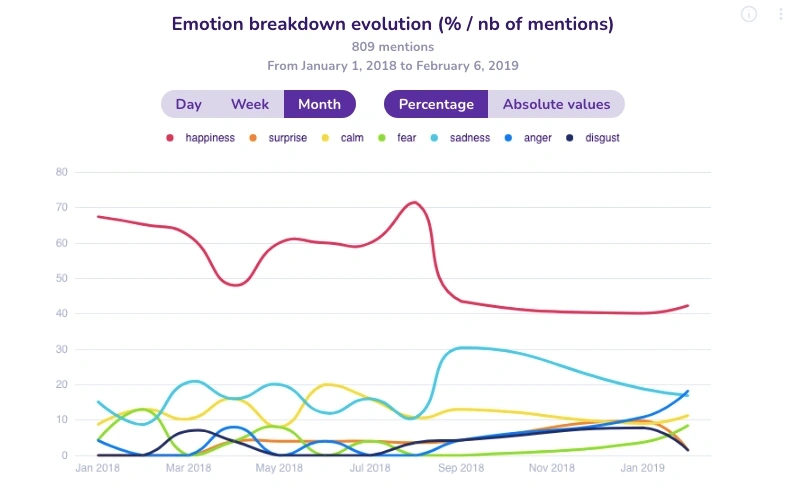
In the screenshot above, for example, we see that there has been a drop in joy and an increase in sadness at the same time from the month of September 2018. It is therefore important to take note mainly of the subjects evoked over this period to understand where this change comes from.
To do so, we choose the corresponding period on the platform which will then automatically identify the 3 points of success and the 3 points of improvement mostly mentioned in the comments.
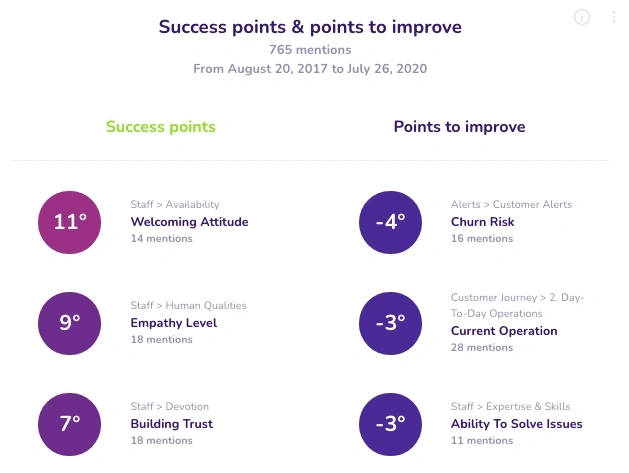
In this example, we see that there are 3 major risks that correspond to this fall in joy and increase in sadness: the churn risk, Current Operation and Ability to Solve Issues. By clicking on the “Ability to Solve Issues” button, we can quickly realize that poorly done customer support is the root of this problem and is mentioned in customer reviews. We can then prioritize the actions to be implemented to solve the problem.
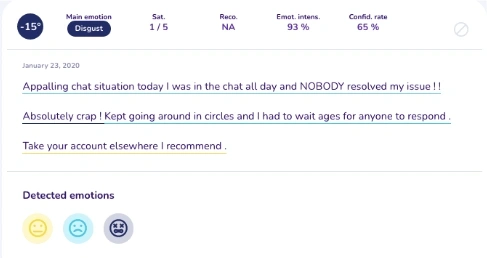
As you understood, automatic semantic analysis is essential when you are conducting large-scale surveys or receiving numerous comments each month on review platforms or social networks.
2.2 Monitoring and alerts
One of the main strengths of the automation of this analysis is the possibility of creating alerts to be notified in real-time when a verbatim corresponding to the chosen criteria is online.
This makes it possible to switch from a passive approach to an active approach and to react very quickly in the event of risk of attrition, bad buzz, etc.
Indeed, when we receive an email that speaks of churn risk, it must be treated as a priority.
However, it can also be put in place positively to share with the different teams the points of enchantment evoked by the customers.
So how do you set up this alert on an automatic analysis tool?
To create an alert with Q°emotion, it's very simple, you have to go to the Email alerts tab.
Then, just follow these 4 steps: Choose or verify your project; Create the alert; Define the conditions, the recipients, and the sending frequency, Validate your choice.
The most important step is to properly define the conditions. If they are not specific enough, you will receive a large number of alerts that are not always relevant, while if the conditions are too restrictive you will probably never receive alerts!
How to properly define the conditions?
To do so, it is possible to use 3 different levels:
- The type of selector: On our platform, it is possible to use 4 different types of criteria: emotion, the themes mentioned, key criteria (such as the number of stars left on a review for example), keywords. This allows you to be very precise in targeting the alerts you want to receive.
- The equivalence criterion: "is equal" or "is not equal to" in order to define the trigger for the alert.
- The link between the conditions: This is what defines whether the alert should be sent when a condition is met or when all the conditions are met.
Thanks to alerts, you will no longer miss critical verbatim and this will greatly help you prioritize your actions and improve customer satisfaction.
Conclusion
A tool like Q°emotion (editor of the CXinsights.io platform) will allow you to save precious time and very quickly identify the subjects mentioned by your customers as well as the emotions they feel.
We were only able to review some of the features of our SaaS platform, if you want to know more, read our client case here. You can also book a live demo by clicking here.
Similar posts
Customer Experience vs. Customer Success: Understanding the differences and maximising customer loyalty through emotional analysis
Published on October 29, 2024 - Updated on November 04, 2024
In an increasingly competitive business environment, companies must now redouble their efforts to capture and retain customers. According to a recent study by Forrester , 73% of companies now...
Reduce holiday stress with Q°emotion: How brands can manage customer emotions over Christmas
Published on October 29, 2024 - Updated on February 14, 2025
Reduce holiday stress with Q°emotion: How brands can manage customer emotions over Christmas Introduction: The Christmas paradox Although Christmas is traditionally a time of joy, sharing and celeb...